
Jan. 17th-25th: Tide Gauge Comparison
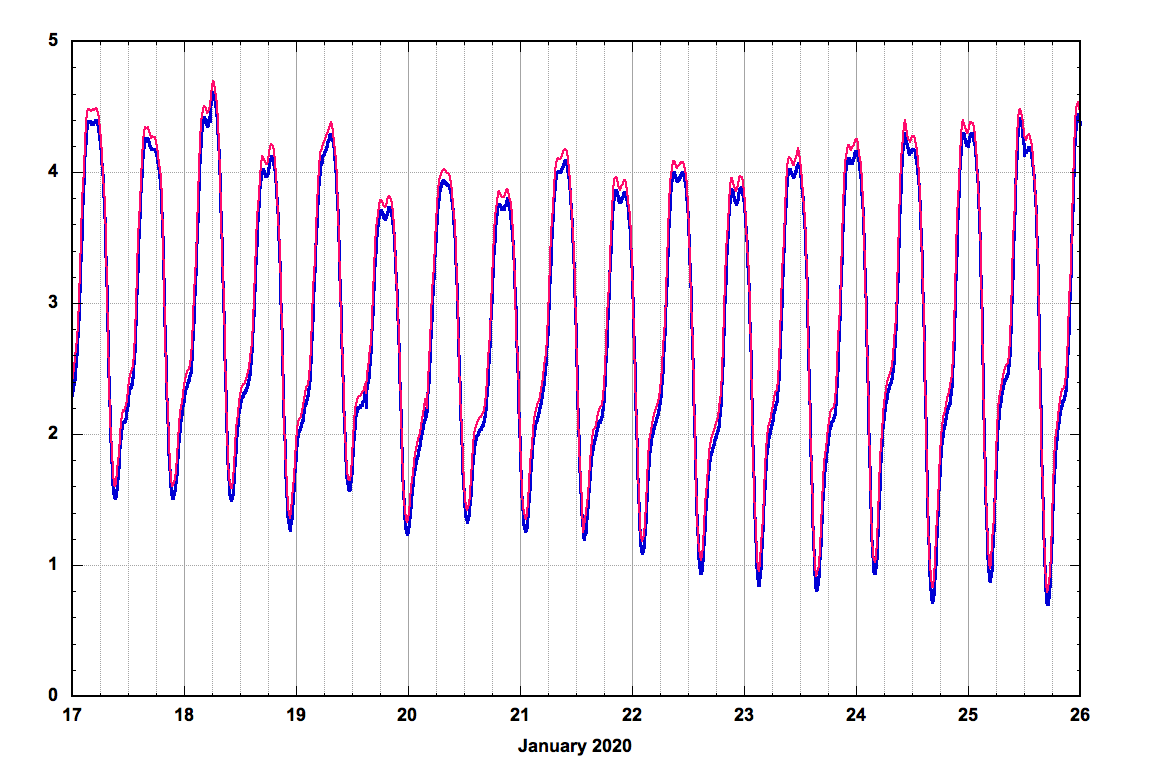
Water levels from the EA Woolston Tide Gauge (red) and the Dock’s tide gauge (blue)
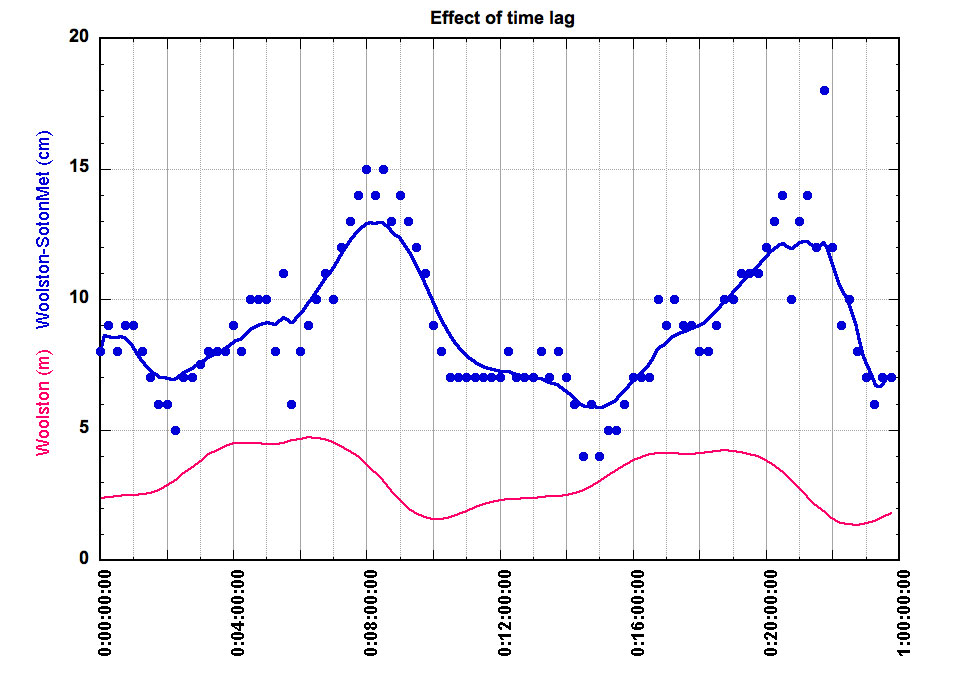
Comparison of data from the Woolston and Dock tide gauges on 18th Jan. showing a time lag in the Woolston data
In assessing the tide height for the surge at around 02 gmt on the 15th January it was obvious that the Environment Agency’s Woolston Tide Gauge was recording higher levels than the one in the Docks shown on the Sotonmet web site.
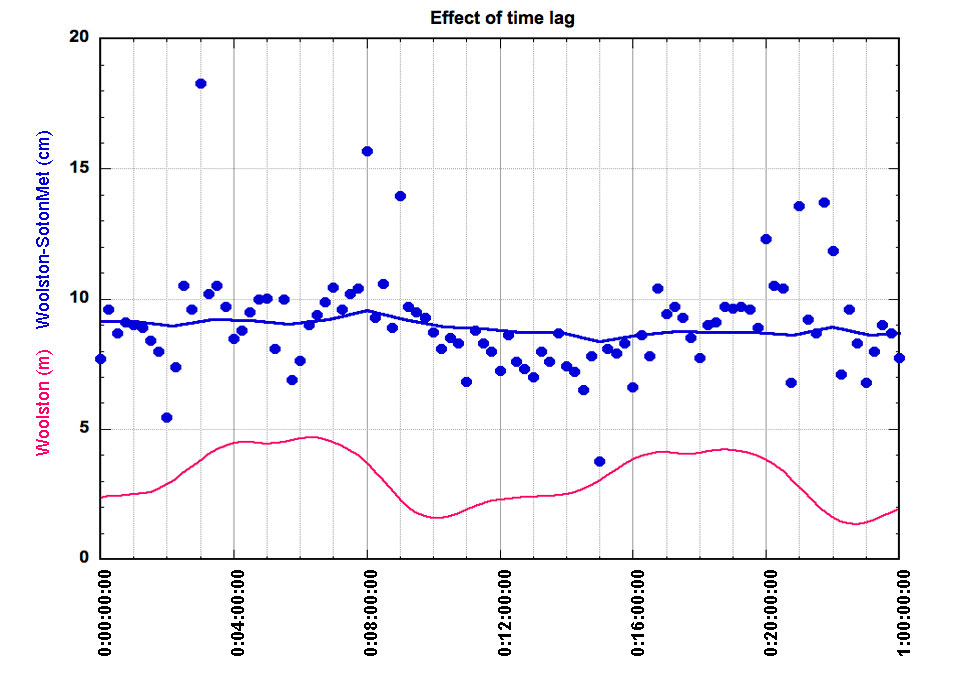
Similar comparison except that a 2 minute lag has been introduced
However, examining the difference between the height data from the two gauges, it appeared that there was either a time shift or a difference in response times for the two gauges with Woolston lagging Sotonmet. Thus when the tide was rising Woolston read lower, and when falling, Woolston read higher. The smallest deviation between the two was achieved by interpolating the Sotonmet data to simulate a 2 minute delay; however the average difference, 9 ± 2 cm was not very sensitive to the amount of lag.
Using tide data between the 15th and 19th January and only comparing the lowest or highest height readings from each gauge gave the result that Woolston was consistently higher by 9 ± 1 cm with no significant difference in the bias between the comparisons at low and high tide.
Which, if either, of the Tide Gauges is correct I do not know, although neighbour Nigel believes that it is the Sotonmet value which is low based on his observations of river heights at the St Denys Public Hard.