24th April: Tidal Surge Forecasts
![]() This is a version of an item I prepared for the NCI Calshot Tower “Blog” explaining that when there is a tidal surge the tide might arrive earlier than shown in the tide tables:
This is a version of an item I prepared for the NCI Calshot Tower “Blog” explaining that when there is a tidal surge the tide might arrive earlier than shown in the tide tables:
In a recent NCI Calshot internal newsletter I set a puzzle. I asked watchkeepers why a car driver, approaching a road which floods at high tide, might find it already flooded …despite having carefully checked the tide tables?
Hopefully most watchkeepers would have answered that low atmospheric pressure might have caused a “tidal” or “storm” surge. A rough rule of thumb is to add 1cm extra depth to the tide for every 1 mb the air pressure is below 1013mb. But I wonder how many watchkeepers pointed out that the extra depth due to a tidal surge might also have resulted in the tide coming in slightly earlier.
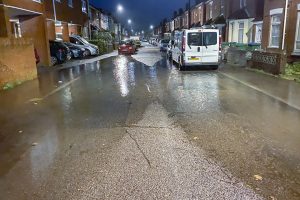
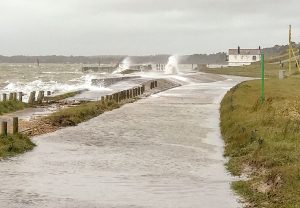
Let’s look at a recent example. The photograph (above) shows a road in Southampton partially flooded due to a surge caused by storm “Brendan” overnight on 14th to 15th January 2020 (see a previous post… “Highs and Lows of Air and Water“). The tidal surge was estimated as around 0.6m.
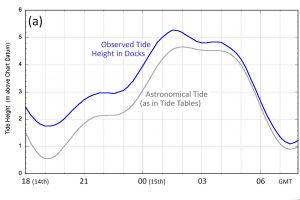
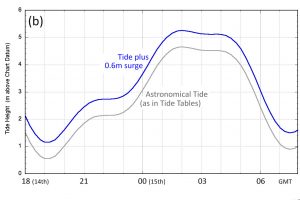
In each of the graphs above (click to enlarge) the “astronomical” tide, as listed in a tide table, is shown by the grey line. The actual water depths observed in the Docks are shown by the blue line in graph (a). Graph (b) shows that simply adding a 0.6m surge to the tide heights does not fully reproduce the sequence of water depth observed.
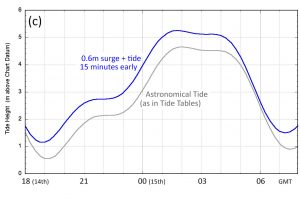
However if, in addition to the surge, we also assume that the tide came in about 15 minutes earlier than shown in the Tide Table, the calculated water depths are much more like those observed (compare graph (c) with graph (a)). Some differences remain; these occur because the storm surge created by Brendan had peaked earlier in the day and was decreasing during the high tide period.
So, when there is a tidal surge the increased depth of water allows the tide to arrive earlier than forecast in the Tide Tables.
While the expected height of a surge can be roughly estimated from the atmospheric pressure, the strong winds over the large area of a storm can also add as much and more again to the surge height. In addition, strong winds locally may create high waves that over-top the sea defences.
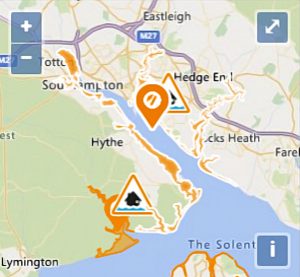 All these factors mean that making an accurate storm surge forecast is difficult. Fortunately the National Tide and Sea Level Facility (NTSLF) provides storm surge forecasts on line for various sites around the UK coast. The same forecasts, but for many more locations, are used to generate the coastal flood warnings given by the Environment Agency Flood Warning Service. Telephone and email warnings are issued to people living in areas threatened by coastal or river flooding if they have signed up for the service.
In a future post I’ll explain how you can use the NTSLF storm surge forecasts to make your own estimate of surge heights …something which is useful if you need to know the likely risk of flooding ahead of any official Flood Alert or Warning from the Environment Agency.

