
16th June: 2m or 1m to stay safe?
![]() On Sunday I ventured out to Lepe Country Park to act as safety “buddy” for the duty watchkeeper. Under Coronavirus regulations a “social distancing” of 2m is presently being implemented and that means only one person can be on watch at Stone Point, or indeed, at Calshot. The Government is under pressure to reduce the distance because 1.5m or even 1m is being used in other European countries. But it appears that the scientific advisors are saying that 2m is safer than 1m and the distance can’t be reduced whilst the number of cases in the UK is still relatively high. So I thought it time to have another look at the evidence.
On Sunday I ventured out to Lepe Country Park to act as safety “buddy” for the duty watchkeeper. Under Coronavirus regulations a “social distancing” of 2m is presently being implemented and that means only one person can be on watch at Stone Point, or indeed, at Calshot. The Government is under pressure to reduce the distance because 1.5m or even 1m is being used in other European countries. But it appears that the scientific advisors are saying that 2m is safer than 1m and the distance can’t be reduced whilst the number of cases in the UK is still relatively high. So I thought it time to have another look at the evidence.
As I’ve noted in previous posts, there are differences in the way cases are counted in different countries so the data are not strictly comparable. However when one compares a number of countries, there seems to be consistency in the conclusions at least at a qualitative level.
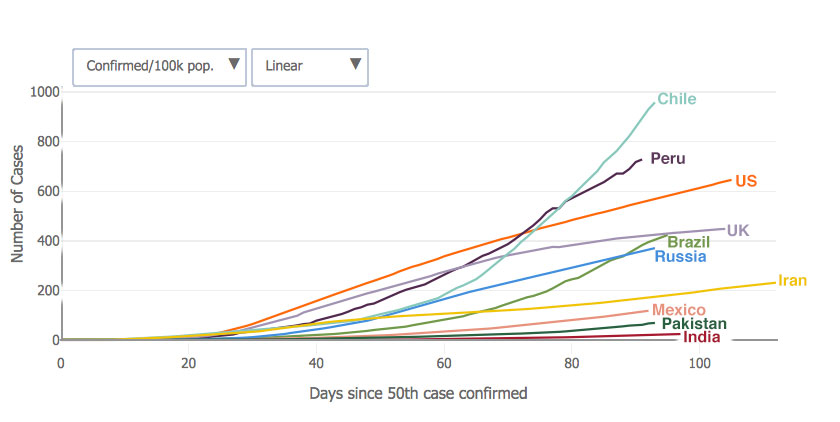
Figure 1. Comparison of cumulative reported cases per 100k of each countries population copied from the JHU web site. The countries shown are those currently with the worst death rate.
Figure 1 shows the cumulative reported case numbers (per 100k of population) for the “worst” performing countries from the Johns Hopkins University web site. This figure was updates with data up to and including Monday 15th June. The JHU web site defines the “worst” countries as those presently having the highest absolute daily number of deaths. As a result the set of countries shown has changed since I previously used this plot. Most European countries are no longer represented; sadly the UK is still there, as is the USA. The situation in South American countries such as Chile, Peru, and Brazil now looks particularly bad. The upward trending lines for those countries indicate large numbers of new cases daily. In terms of the total number of cases, with its large population (around 212 million) Brazil is now second only to the USA.
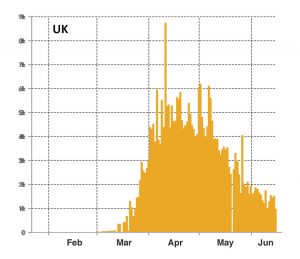
Figure 2 shows the number of new cases each day for the UK, Italy, and the USA. For Italy and the USA the vertical axis has been scaled to allow comparison to the UK despite their different populations. While the number of new UK cases each day is decreasing (Fig. 2a), it has not yet reached the lower level of new cases occuring in Italy (Fig. 2b) . Other European countries have numbers of new cases similar to Italy. Arguing that the 2m social distancing value in the UK should be reduced in comparison with other European countries ignores the higher level of infection still prevalent in the UK.

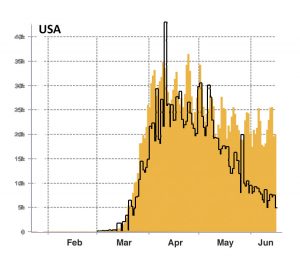
The USA (Fig. 2c) might be an example of what happens when you decide to relax social distancing rules and other lockdown measures while the rate of new cases is high. Trump was recently on TV signing a regulation about policing flanked by people in uniform, presumably high ranking policemen, who showed no attempt at social distancing. Trump says that the high, possibly increasing, number of cases in the USA is because they are increasing testing, not because the virus is spreading. Although much of what Trump says is demonstrably not true, the case/fatality ratio in the US, at 5.5%, is particularly low; about a third of that for the UK so there may be some truth in a testing bias.
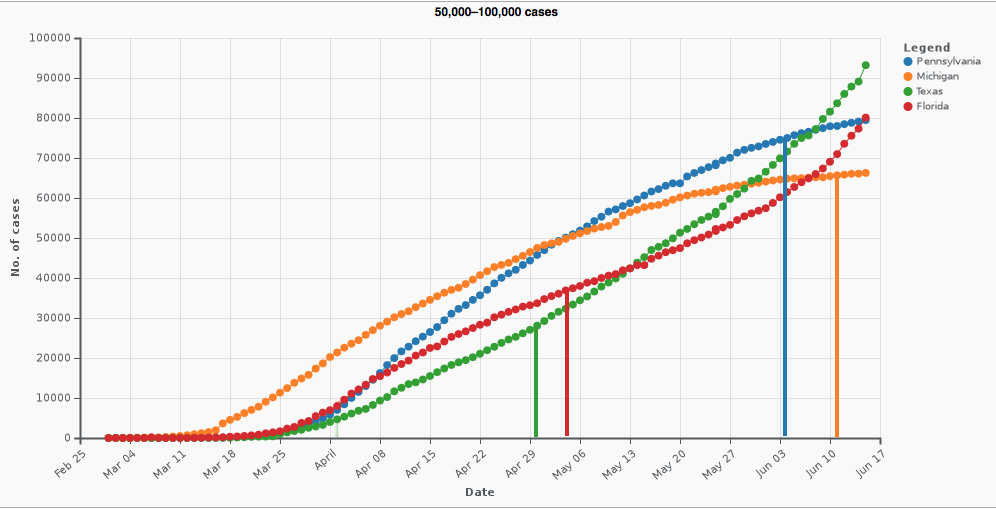
Figure 3. Cumulative number of cases for four US states (Wikipedia). I have added vertical lines to mark the lifting of lockdown (approx.) for each State (source: Google).
On the other hand Figure 3 shows that for Texas and Florida, the number of cases increased more rapidly following early lifting of the lockdown, compared to Pennsylvania and Michigan, which stayed in lockdown longer. Looking at the data for all the mainland US states (available on the JHU web site ) it appears that most states in the northeast of the USA have suppressed the epidemic whereas many states in the south are seeing an increasing infection rate as lockdown restrictions are lifted or ignored. For some reason, the west coast states (California, Oregon and Washington) also don’t seem to have the infection fully controlled despite their imposed lockdown restrictions.
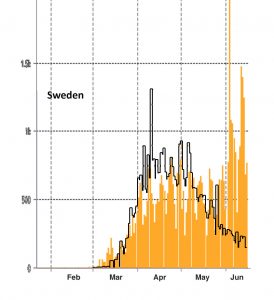
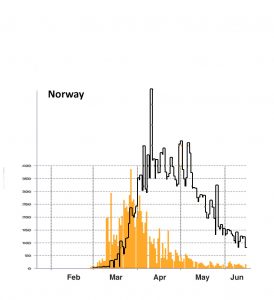
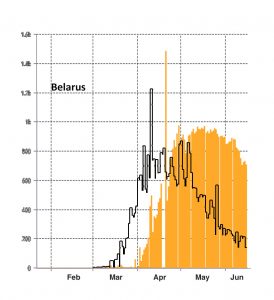
Consider now the effect of different lockdown strategies (Fig. 4, again scaled according to population). In Sweden (Fig. 4a), where they had no formal lockdown but asked people to be careful, either there has been a change in the way they count cases or the virus is now getting well out of control. For comparison, neighbouring Norway (Fig. 4b) had a formal lockdown which has been very effective. We are told that Belarus (Fig. 4c) has ignored the virus but the cases now appear to be decreasing. However if the virus has been “ignored” then one wonders how accurate are the statistics?
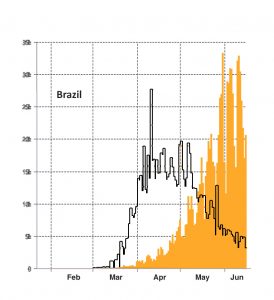
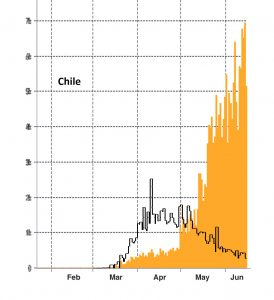
At the start of this post, Figure 1 highlighted the large daily number of new cases occurring in Chile, Peru and Brazil. With its large population, Brazil (Fig. 5a) dominates the total number of cases, however scaled by the population Chile (Fig. 5b) and Peru are more badly effected. In the these South American countries the infection rate is still rapidly increasing but despite that the lockdown measures are being relaxed, mainly for economic reasons.
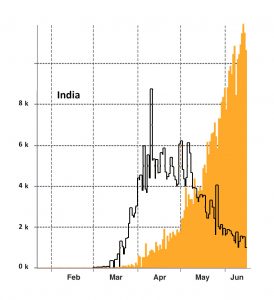
The same is true for India (Fig. 5c) where the epidemic appears to be in its early stages and yet the lockdown is being relaxed. As a fraction of the population, the number of confirmed cases in India is still small so unlike all other Figures, Figure 5c has not been scaled according to population but represents the actual number of cases. That number has already surpassed the peak for the UK. India has a population 20 times that of the UK, the potential for suffering there is horrific… as it is for other countries in the region such as Pakistan and Bangladesh. It seems likely that similar tragic events are about to occur, or already occurring, in Africa.
Some Conclusions:
- The infection rate in the UK is still significantly higher than other European countries which are being sited as providing justification for easing lockdown restrictions in the UK, such as the 2m social distancing rule.
- Comparison between US States shows the potential danger of easing lockdown too soon.
- Countries such as Sweden and Belarus illustrate the perils of not having a lockdown.
- Countries in South America, the Indian sub-continent, and potentially Africa, illustrate the problems of being forced out of lockdown for economic reasons before the epidemic is under control.