
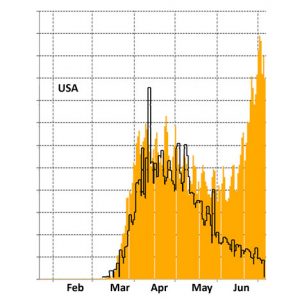
So what’s happening in the USA?
![]() [I downloaded the data and plots for this at the start of July but then have been distracted by other tasks so I’m finishing writing it up at almost mid July. Meantime the coronavirus situation in the USA has got worse rather than better]
[I downloaded the data and plots for this at the start of July but then have been distracted by other tasks so I’m finishing writing it up at almost mid July. Meantime the coronavirus situation in the USA has got worse rather than better]
Some states in the USA are reporting what they euphemistically call a “spike” in infections when really they mean a significant increase. In other states the infection appears to be under control. Meanwhile Trump tries to claim that any increase is due to an increase in testing rather than any increase in infection.
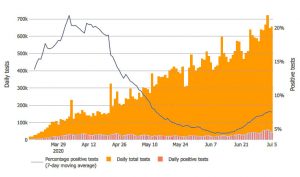
However this does not look at all plausible from the data. The rapid increase in confirmed cases in the USA during June is in contrast to the decrease in the UK. The graph of daily testing in the USA shows a month by month increase in numbers of tests but it does not show a rapid increase in testing numbers during June.
So does the trend on infections in different states provide guidance as to which lockdown policies are most effective? First consider some example states in the northeast of the USA. On each plot the confirmed cases for the UK for the period to 2nd July is shown by the black line. The data from each state has been scaled, first according to the population, and second according to the average number of tests conducted in each state during the period 22nd January 2020 to 2nd July compared to the number conducted during the same period in the UK (this “testing based” scaling is indicated by “adjust2” on the plots).
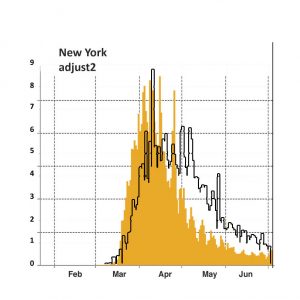
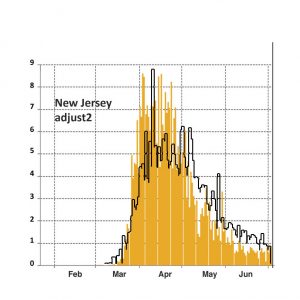
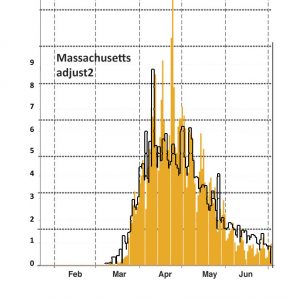
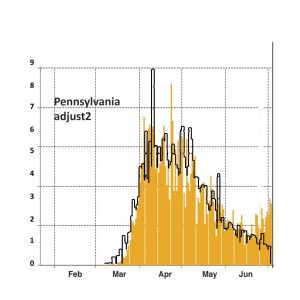
As was well publicised, the initial worst infection was in New York state (and more specifically New York City) but that outbreak seems to have been brought under control. Similarly in New Jersey and Massachusetts. where the peak occurred slightly later than in New York. Of these examples, Pennsylvania is also fairly similar but with the suggestion that the outbreak there is flaring up again.
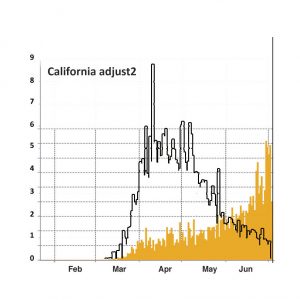
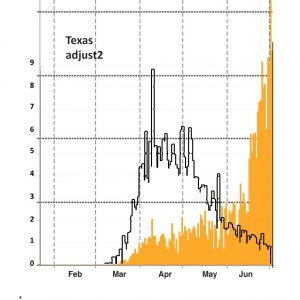
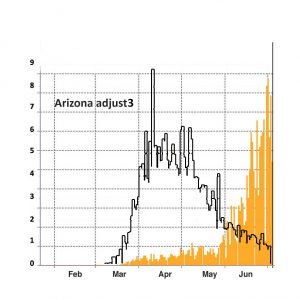
Now consider some example states where there has been a significant recent increase in the number of cases. For Florida, California, and Texas the plots have been scaled by population and then by mean testing rate (“adjust2”). For Arizona, adjusting for mean testing rate resulted in the plot of recent case numbers being well off scale, so instead the plot has been scaled by the recent (rather than mean) testing rate (“adjust3”). It is stressed that for all these examples the comparisons should be viewed as qualitative rather than quantitative.
What is apparent in these plots is that, during the main period of outbreak in the UK and in the northeast states, these states experienced a relatively small outbreak. This lead to lockdown restrictions being relaxed in some states (Wikipedia). In general these lockdowns seem to have been imposed during April but lifted early to mid May. In some states there had been protests against the lockdown restrictions.
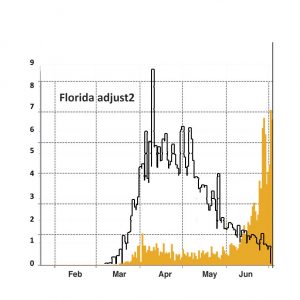
The impression one gets is that in these states the lockdown was applied at a time when the incidence of illness was at a level where, for example, the UK government believes that it is OK to ease restrictions. Consider Florida for example. The lockdown started at the start of April (April 3rd) and lasted till the start of May (May 4th). During that time the number of cases decreased. The significant increase in cases started a full month after lockdown was eased, perhaps not surprising if one factors in up to a 2 week incubation period plus time for the infection to spread.
The rate of testing in Florida was twice that of testing in the UK. If I had not scaled to try to take that into account the Florida plot would be 2 times higher. In other words, when Florida lifted lockdown the level of infection was similar to or less than the level in the UK at which the Government feels lockdown can be eased. TV reports from Florida have shown crowded beaches and rowdy bars, but similar reports in the UK have shown crowded Bournemouth beaches and people spilling out of Soho (London) pubs. So the US experience holds a warning for the UK and England in particular, although I don’t think precautions here are being ignored to quite the same extent.
What has triggered the increase in cases in the US? It is easy to blame Republican Governors in Southern States but it seems most likely that the present increase is due to the actions of a significant fraction of the public in abandoning precautions. Of course the social climate created by the political leaders must take much of the blame for that. Now that a lockdown is desperately needed the politicians have adopted economic arguments against it, most especially from the White House. Similar arguments to those that will prevent them taking the required action against climate change.
Meanwhile many people in southern US states appear unwilling to accept new restrictions and, from what one sees on TV ( I watch CNN ), do not seem to believe that measures like social distancing are necessary. It would appear that this is particularly true in the 20’s to 30’s age group* who feel “immune” from the worst effects of the virus. Unfortunately, even if only a small percentage develop serious symptoms, that can result in a significant number of deaths and much suffering in a country as large as the USA. It also has the potential to spread the virus back into old age groups with consequently a higher rate of serious consequences.
* you have to be over 21 to drink alcohol in bars in the USA and enforcement is stricter compared to the UK with ID checks for anyone looking too young.