Inshore currents off Lepe Country Park
(This is a copy of a post I wrote for the NCI Calshot Tower “Blog”.)

The photo shows a family standing at the water’s edge just to the east of Lepe Spit. The position of the Spit can easily be identified by the change in colour of the water. But why does it look like that?
The wind is blowing from the southwest (right to left in the photo) creating waves which make the water appear darker in the righthand part of the image. The time is coming up to, or an hour or two after, high tide at Portsmouth, and the current is flowing against the wind (from left to right). The shallow water over the spit causes the current to speed up. At the Spit it is flowing so fast that the wind generated waves coming from the southwest have been brought to a halt. Unable to progress against the current the waves steepen and break along the upwind side of the spit.
The water in front of the family group is smooth because it is too close to the Spit for the wind to have generated new waves to replace those that could not get past the strong current at the Spit. The water appears lighter in colour because, without waves, it better reflects the colour of the sky.
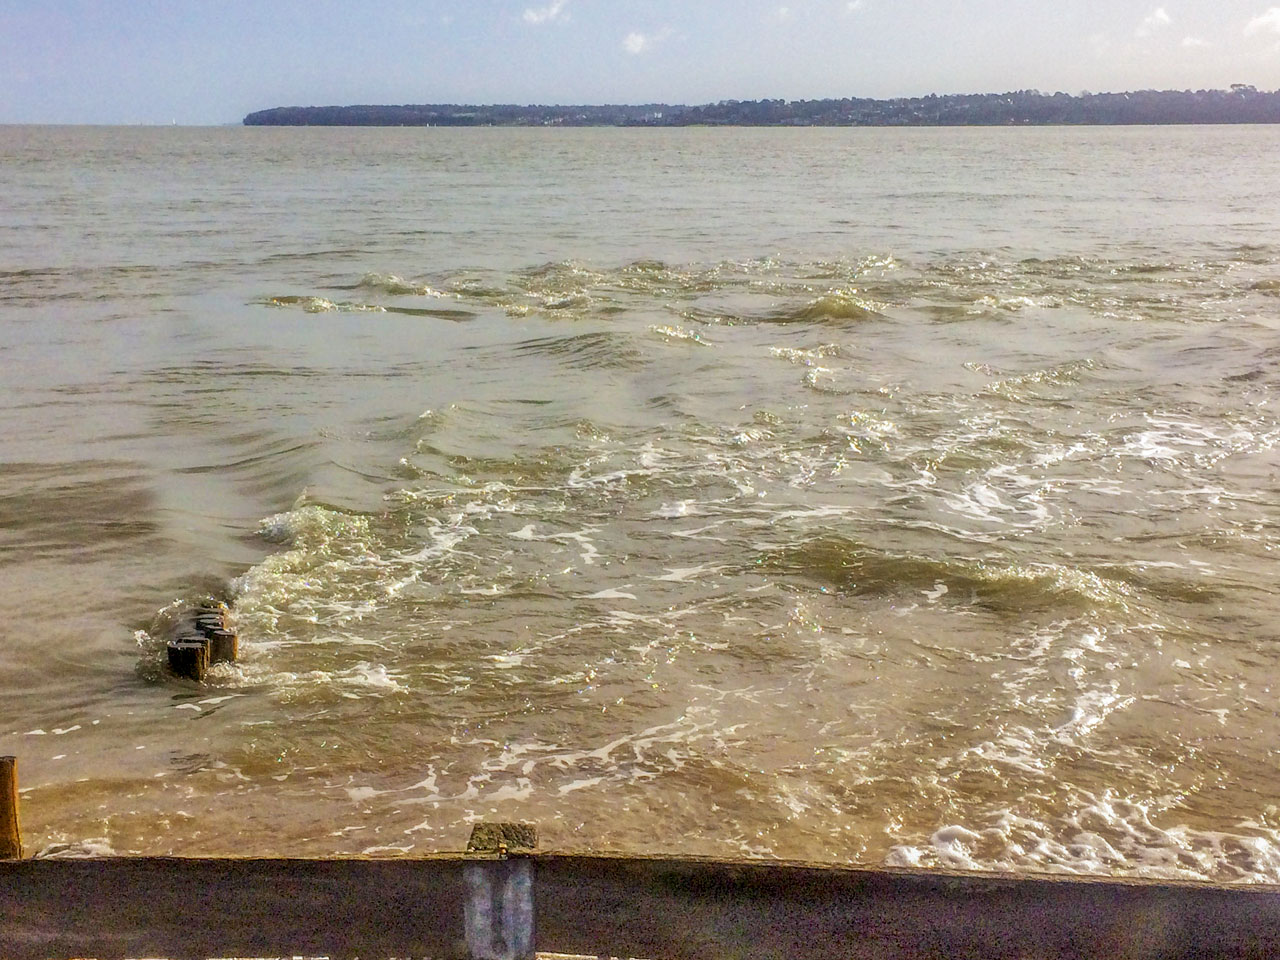
Strong currents at Stansore Point
This second photo shows currents rushing past the beach at Stansore Point. Currents at both Lepe Spit and at Stansore Point can be very strong; too strong to swim against. That is particularly true when the current is flowing westward, but eastwards currents can also be dangerous.
How do you know when and where the currents off Lepe Country Park will be strong?
A numerical model has been used to calculate the currents every half hour for a tide of typical strength (3.5m tidal range). Although the real currents on any particular day will be different (due to varying tides and weather conditions), the model results should give a guide to what to expect at each stage of the tidal cycle.
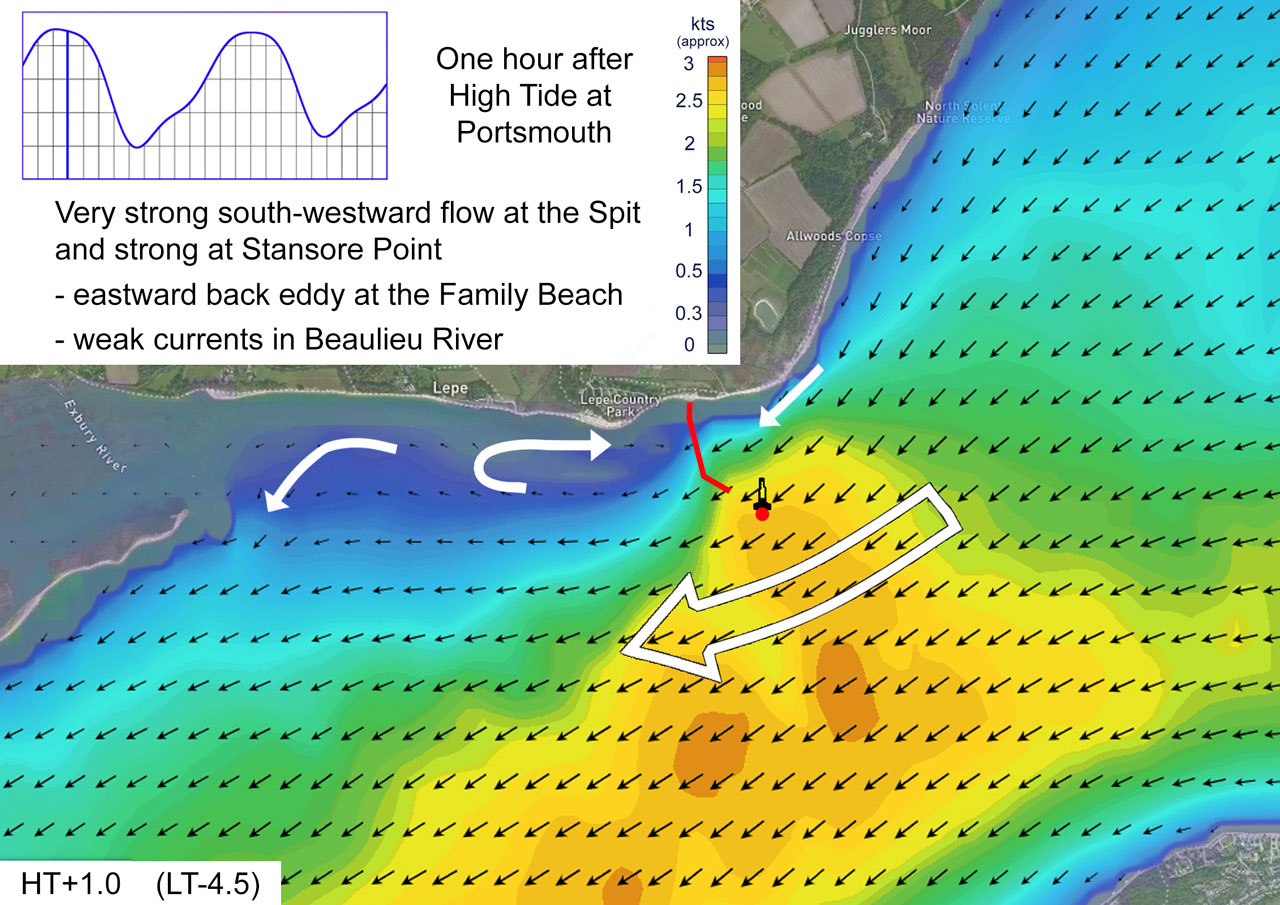
Currents at one hour after high tide at Portsmouth.
Diagrams of the currents calculated by the model, like the example shown, are available as a pdf document:
“Inshore Currents off Lepe Country Park”
which can either be viewed in your browser, or downloaded to make it easier to access particular parts of the tidal cycle.
Alternatively the results from the model can be viewed as two videos:
Part 1: Eastwards Flow
(about one hour before low tide to 90 minutes before high tide)
Part 2: Westwards Flow
(90 minutes before High Tide to shortly before Low Tide)