9th April: In search of Chart Datum
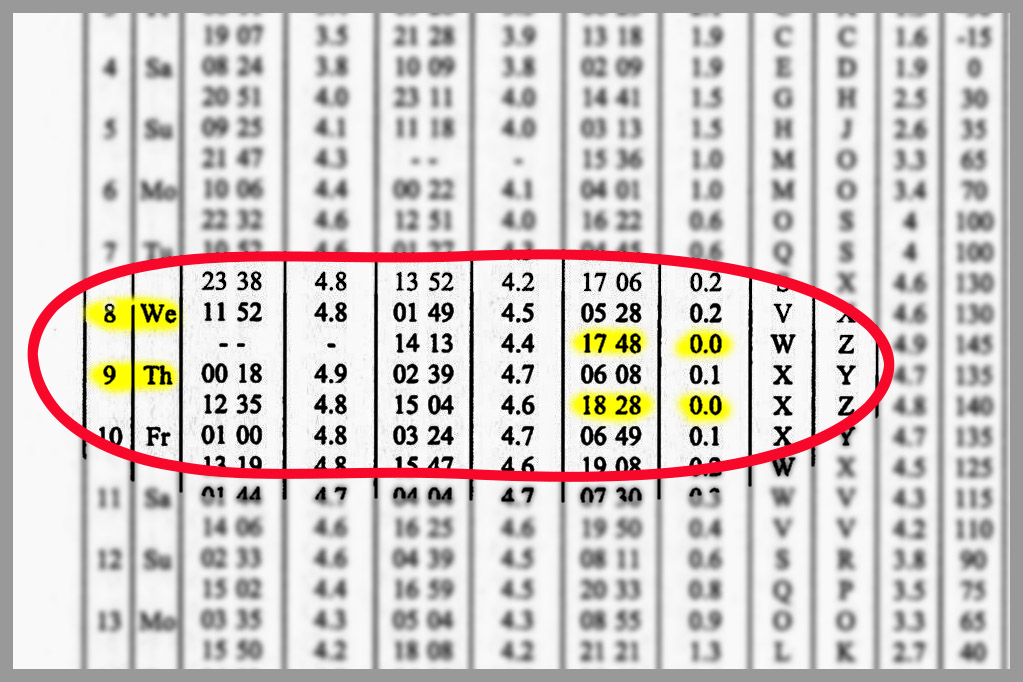
From ABP Southampton Tide Table for April
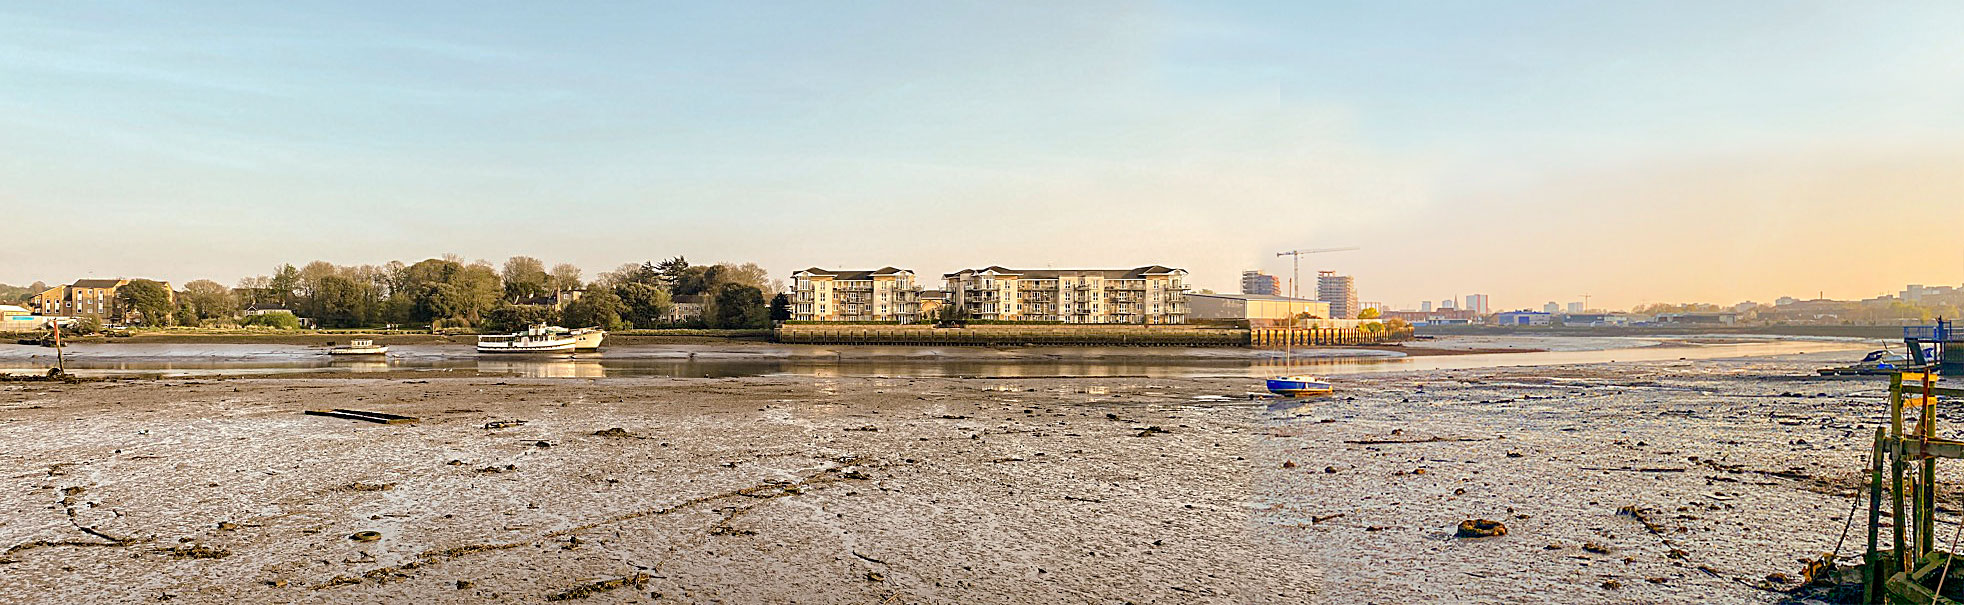
![]() The concept of “Chart Datum” is fundamental to understanding the depths on charts or interpreting tide tables and yet in the lectures to trainee NCI Watchkeepers some people seem to struggle to understand it. So when I saw that the ABP Southampton Tide Table that the low tides on the evenings of the 8th and 9th September were predicted to be at Chart Datum I thought I’d try to illustrate what that looked like.
The concept of “Chart Datum” is fundamental to understanding the depths on charts or interpreting tide tables and yet in the lectures to trainee NCI Watchkeepers some people seem to struggle to understand it. So when I saw that the ABP Southampton Tide Table that the low tides on the evenings of the 8th and 9th September were predicted to be at Chart Datum I thought I’d try to illustrate what that looked like.
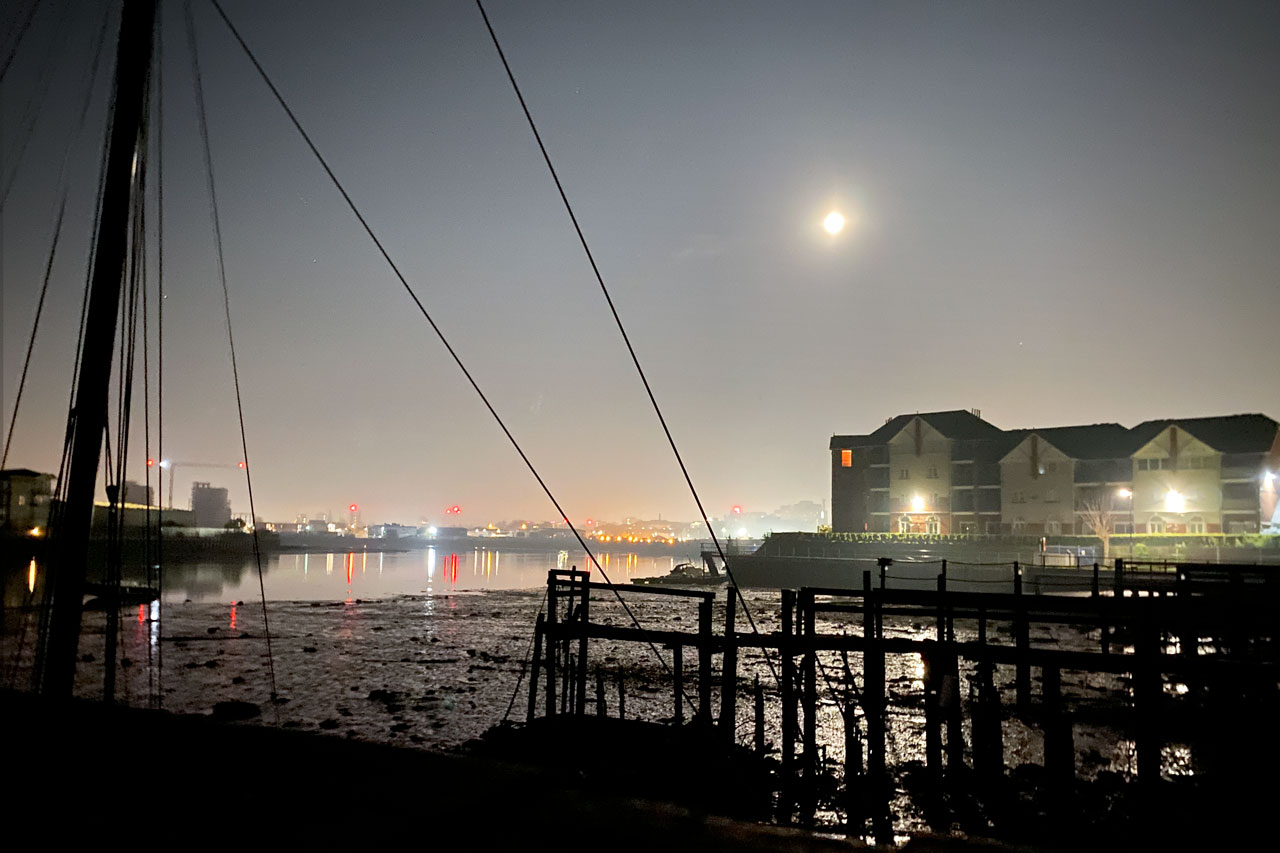
Supermoon over St Denys
The exceptionally low tides came just after a “supermoon” with the full moon at only 357,035 km from the earth; it’s closest “perigee” is 356,500 km where the distances are defined as from the centre of the moon to the centre of the earth. On one occasion in the past I visited a French observatory (probably the Côte d’Azur Observatory near Nice) where they were measuring the distance by bouncing a laser off retroreflectors on the moon’s surface – they can achieve millimetre precision but presumably not overall accuracy! We were allowed to put our hands in the laser beam because, although very powerful, it is very rapidly pulsed.
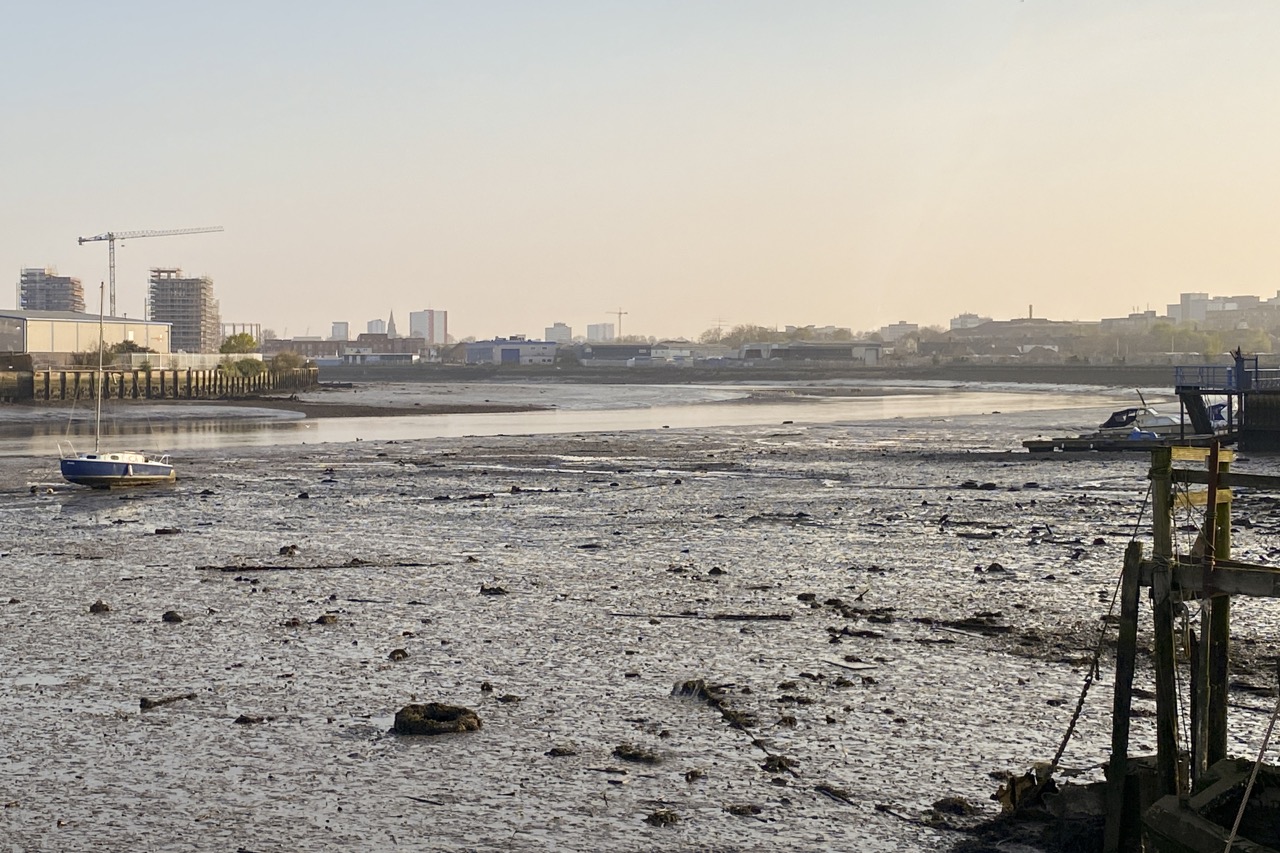
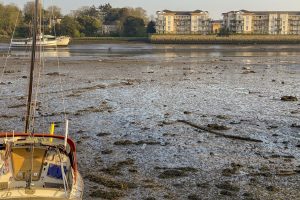
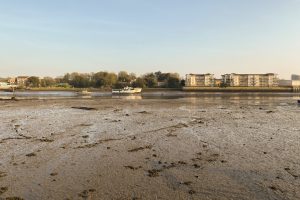
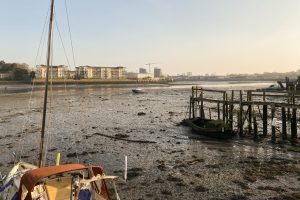
The remaining water in the channel was probably only around 20cm deep, some of it being fresh water river flow.
So how low was the low tide? The tide gauge in the Docks used by VTS and shown on the Sotonmet web site gave a lowest value of 0.1m at 1825BST on the 9th April. However after that the data values were missing until 1850BST when 0.11m was recorded. This suggests that the tide gauge either dries out at 0.1m or does not record values below 0.1m. The Woolston Tide Gauge operated by the Environment Agency recorded values of about 0.35m between 1815BST and 1900BST suggesting that that tide gauge dries out for water levels below 0.35m.
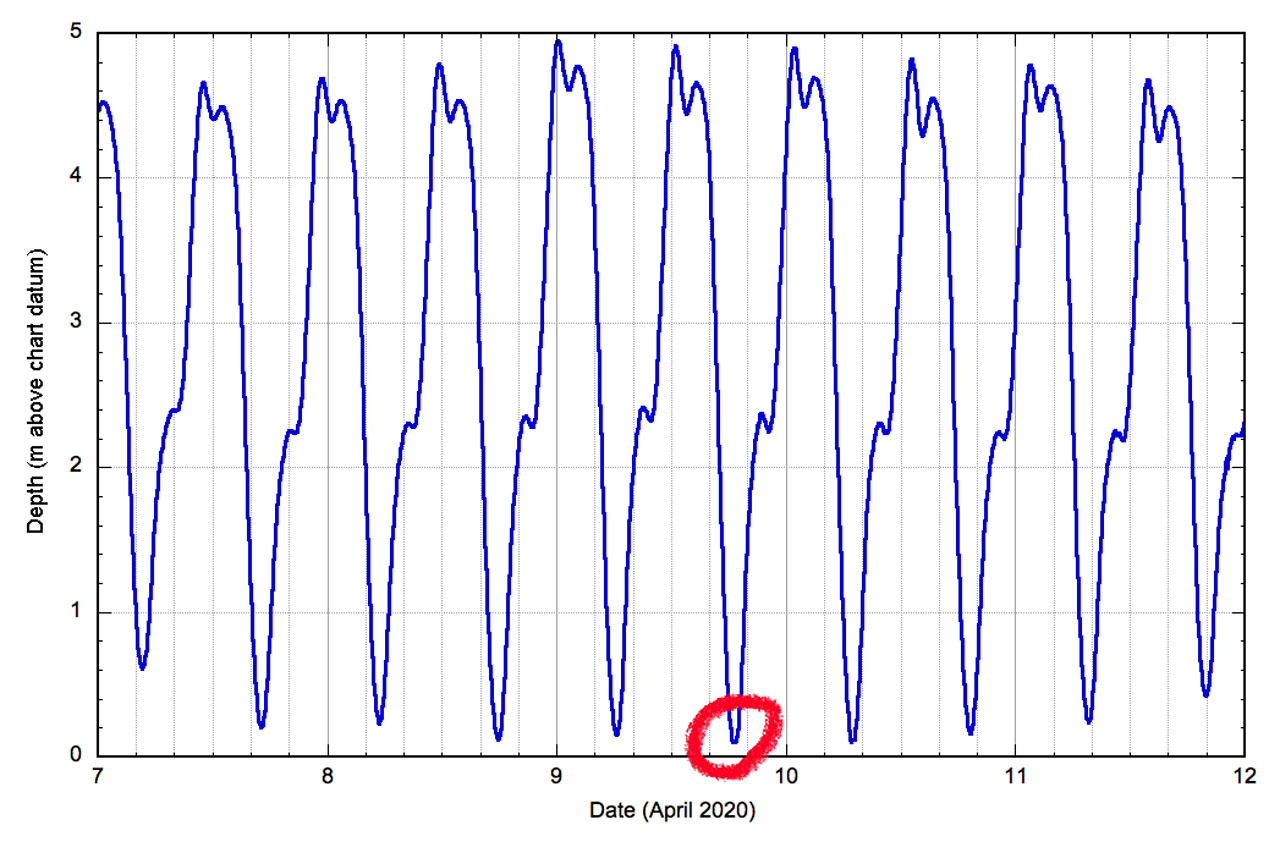 Tide heights from the VTS tide gauge obtained from the “Sotonmet” web site. |
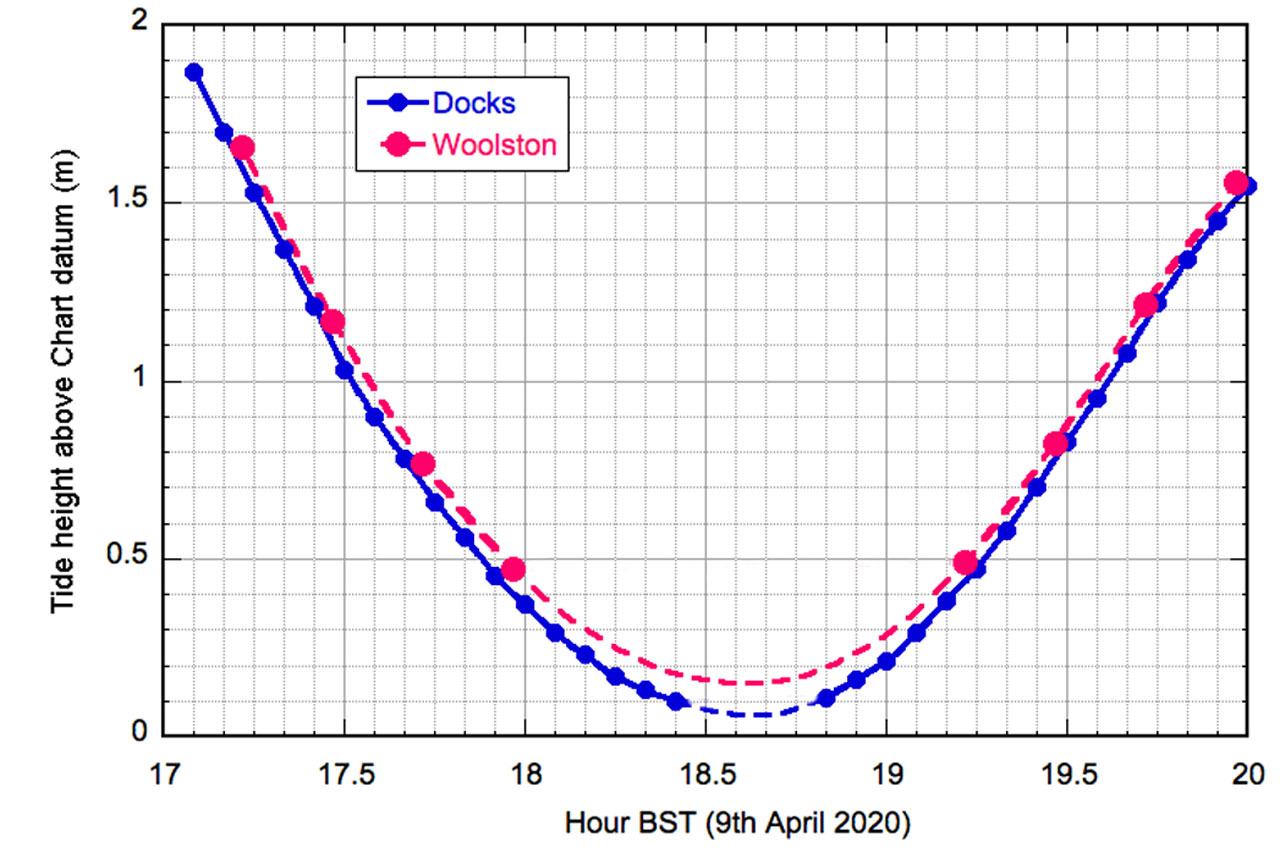 Data from the Docks and Woolston gauges around low tide on the afternoon of 9th April. |
The recorded values from the two tide gauges between 1700BST and 2000BST are shown in the second plot. The Docks data is available at 5 minute intervals and the Woolston data at 15 minute intervals. Previous comparisons of the gauges suggested that times for the Woolston gauge are 2 minutes in advance of the Docks times, for which I have corrected. They also suggested that the Woolston gauge reads about 10cm deeper water levels than that in the Docks, which has been left unchanged. The missing data points have been filled in using a standard curve fitting techniques (“cubic spline”) which may or may not represent the real values.
The plot suggests that the minimum water level was between about 6cm to 16cm above chart datum, depending on which gauge you believe. What did this look like for the River Itchen near the Public Hard in St Denys? Here are some more photos.