
18th May: another virus update

![]() Frustrated with the incredibly poor way journalists were presenting information on the covid-19 outbreak I presented my own analysis on 6th April which used the number of reported deaths combined with a guessed mortality rate to determine the rate of infection in the country. Since the journalists haven’t improved on their analyses here’s an update which is based mainly on the obvious need to normalise the data according to the population of each country!
Frustrated with the incredibly poor way journalists were presenting information on the covid-19 outbreak I presented my own analysis on 6th April which used the number of reported deaths combined with a guessed mortality rate to determine the rate of infection in the country. Since the journalists haven’t improved on their analyses here’s an update which is based mainly on the obvious need to normalise the data according to the population of each country!
Starting from last Saturday the NCI stations are beginning to open on a single manned basis. That is a problem for Calshot Tower, although Lepe may soon open. We were asked whether we were prepared to re-start watchkeeping but I decided not. I’d like to leave it for a week or two more to see how the infection progresses now that, from 13th May, the Government has eased lockdown restrictions.
Why? Having delayed going into lockdown by one or two vital weeks I now wonder if they are relaxing the rules two early. It’s true that other European countries are relaxing their measures but, if the statistics can be believed (and there are lots of possible problems), those countries are further through the outbreak than the UK.
The plots below are from the Johns Hopkins University web site and show the number of confirmed cases on a daily basis for six countries. The data goes up to the end of Friday 15th May. I have stretched or shrunk the plots vertically to adjust for the difference in population between the different countries and the UK. What look like errors in reporting for certain days in France and Spain means I have had to stretch the original JHU graphs quite a lot but the overall shape should be good.
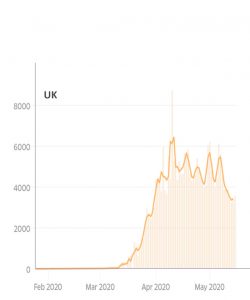
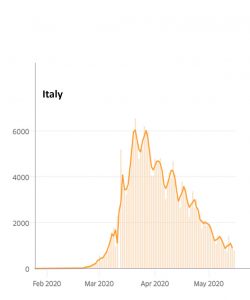
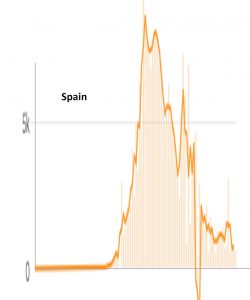
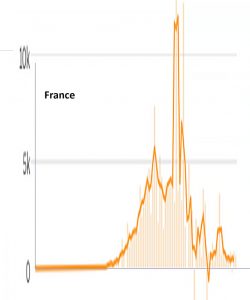
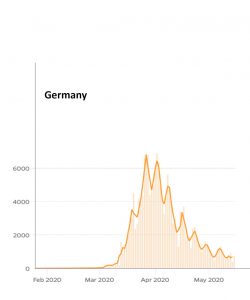
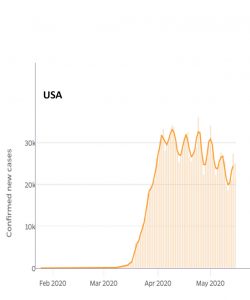
Despite the press constantly saying that Italy was worst affected (until the UK overtook them), corrected for population size Spain was far worse. The UK has a population of about 68M, Italy 60M, France 65M, and Germany 84M whereas Spain has only about 47M. But Spain had a very stringent lockdown in which you had to fill in a form to leave the house. It seems to have worked and they, along with Italy, France, and (of course) Germany, have all reduced the number of new cases significantly. Although the number of cases is declining in both the UK and the USA (population about 330M) they have not yet achieved the reduction shown in the other countries.
Another way of looking at the same data is a cumulative plot of the reported cases per 100k of the population, this is shown below, again from another part of the JHU site. Again Spain stands out as the worst as does Belgium but the latter have operated a different (possibly more honest) counting technique. For Spain, Italy, France and Germany the curve has “flattened” which simply means that only a relatively small number of cases are being added each day. Not so for the UK or the USA.
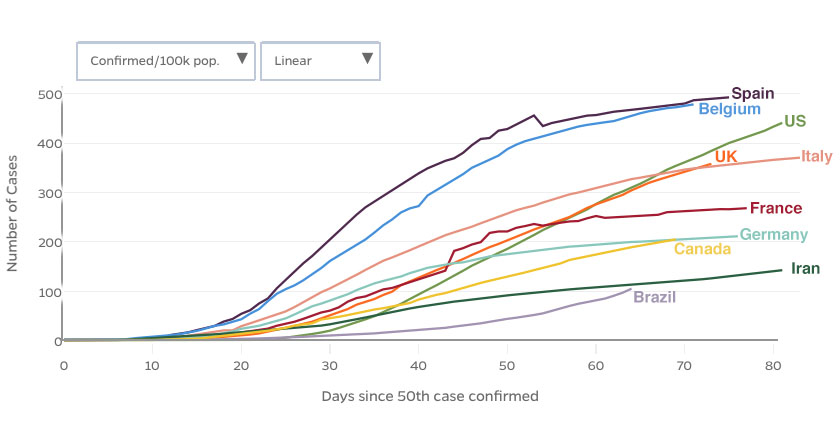
Figure 2. Comparison of cumulative reported cases per 100k of the countries population copied from the JHU web site
Now the UK Government would say that the plots can’t be compared because the counting is different and statistics like deaths in hospital show a greater decline. They say the UK looks worse because we count differently and no doubt the data for different countries are not truly comparable. However one can only use what’s available. For the UK, more reliable statistics can be got from the Office of National Statistics web site and that does show such a decline, however the data are only available up to the end of April, they are useless for trying to gauge what’s happening here and now!
Using the information on deaths from the JHU web site and again using the data normalised by population we see the plot shown below. The curve for the UK is indeed starting to flatten but not to the extent shown for Spain, Italy or France. The UK Government would say that this is because deaths outside hospitals are now being counted for the UK but not for other countries. It’s hard to know what this plot would look like if data for different countries was completely comparable.
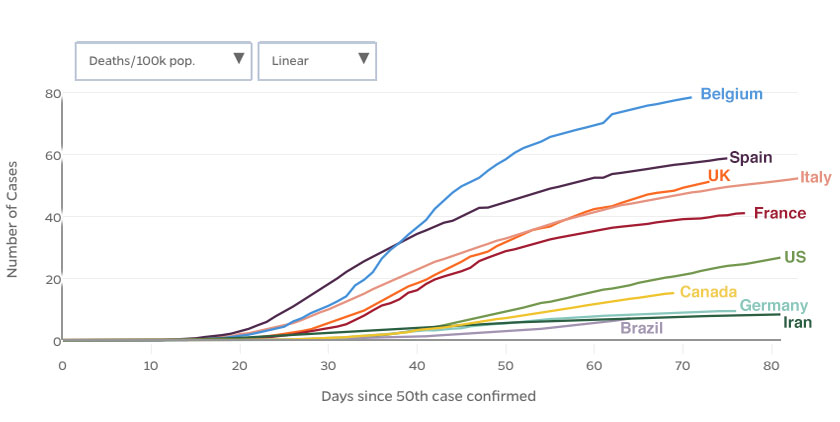
Figure 3. Comparison of cumulative reported deaths per 100k of the countries population copied from the JHU web site
Looking at Figure 1 one gets the impression that once the number of cases reaches some level then the cases start to decline and so far, touch wood, there is no evidence of a “second spike”. Is this due the the lockdown regulations in all the countries or is it, for example, because northern hemisphere summer is coming?
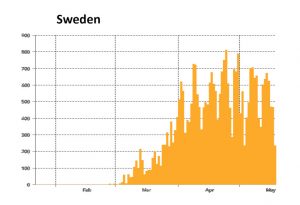
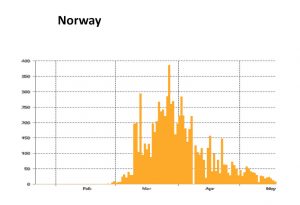
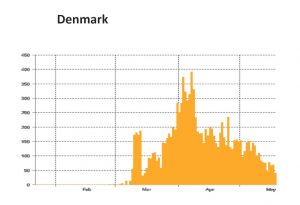
How effective is a “lockdown”? Figure 4 shows the number of cases in the Scandinavian countries from the JHU web site “dashboard” this and further figures includes data up to 18th May 2020). The vertical scale has been adjusted acording to the countries populations. As I understand it, Sweden has not had a formal lockdown told people to take care (I guess the UK government would say “Stay Alert”). Norway and Denmark have had formal lockdowns. Comparing the three one gets the impression that if people simply “take care” or “stay alert” the transmission of the virus is limited but that it needs a formal lockdown to more rapidly reduce the spread of the virus through the country. However apparently Sweden are having a crisis in care homes so, like the UK, they might claim that the continued high level of cases is due to care home infections.
What would happen if you simiply ignored the virus? Apparently that has been government policy in Belarus. Figure 5 shows confirmed cases for the UK and Belarus with the vertical axis scaled according to population so as to be directly comparable to Figure 4. Despite the UK lockdown, cases in the UK are as great or greater than those in Sweden even after allowing for the difference in population. In Belarus the infection has started later and become worse, but so far not exploded to the extent one might imagine. On the other hand it seems likely that the number of cases will stay stubbornly high in the absence of an official lockdown. In Brazil the epidemic appears to be just taking hold and there are worrying reports of the health service struggling to cope.
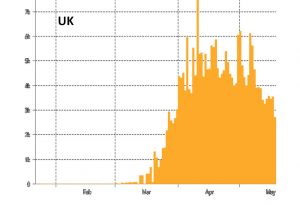
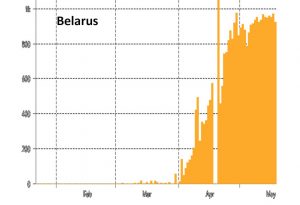
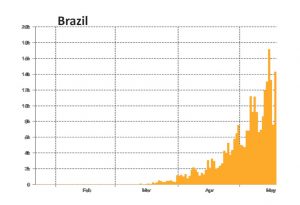
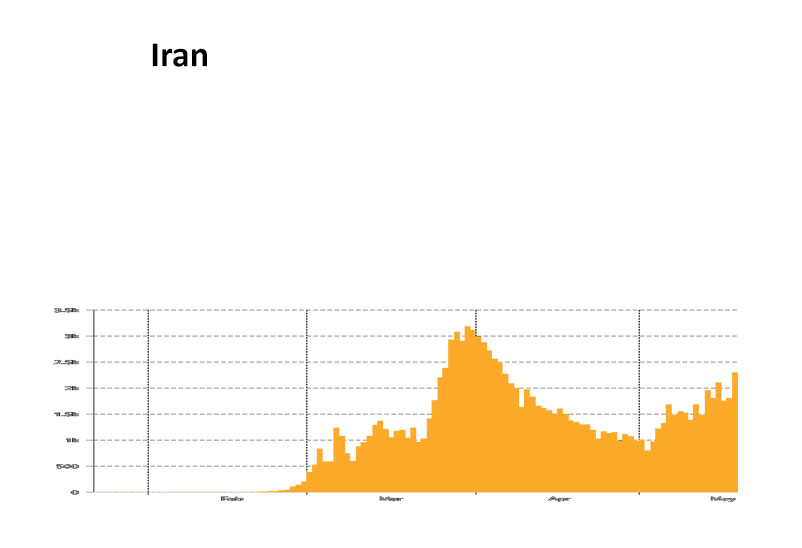
Fig.6. Cases in Iran normalised to the same vertical scale as figures 4 and 5.
The data from Iran has puzzled me. There was a rapid increase in infection but then the number of cases stayed fairly constant. Now it looks as if it is at risk of a “second spike”, I hope it is not going to get worse. I can’t help wondering, however, if the month of Ramadan (starting around 24th April) may have affected reporting of cases as well as possibly influencing the spread of the epidemic.
My conclusions from all of this? A strong lockdown as occurred in Spain and Italy is important in reducing the infection rate in the population, the lockdown in the UK has not been stringent enough. It is not yet clear to me whether the UK had reached the level where the lockdown could be eased and I think that the Government is taking a gambol. I hope that they are correct.