27th Nov: Astronomical Tide Values (1)
Introduction: To define the tidal curve for a place and time the most obvious choice would be that provided by the Admiralty. Unfortunately nowadays their “EasyTide” website no longer allows one to go back in time, so unless you grab the data before or on the actual day, you can’t analyse past events. As a substitute for the Admiralty data I have used the “MrTides” application running on my Mac computer and this seemed a reliable source of tidal data. MrTides has now been updated to “AyeTides for the Mac” and I assumed it would continue to be reliable. However when i started studying the tidal surge on 2nd November I could not make sense of the tidal residuals. I have therefore run a comparison of the various tide data sources available to me.

Fig.1. Comparison of AyeTides tidal curve for Portsmouth and the digitised 5 minute values (red circles) used for analysis.
Method: On the early afternoon of 24th November I made screen grabs of astronomical tide curves for Southampton from EasyTide and Portsmouth from EasyTide and the National Tide and Sea Level Facility (henceforth NTSLF). I obtained the tidal curve from AyeTides, and also from Mr Tides by running it on an old computer. For each of the screen grab images I used the PlotDigitiser PRO application to create a data set of tide heights against time. To enable direct comparison of the data sets I used the interpxy() Excel function from ExeLab 365 to create data sets of astronomical tide height at 5 minute intervals. Given that the curves had been digitised at short enough intervals to adequately represent them, I simply used the default parameters for the cubic spline interpolation routine judging that the data would be well constrained. As an example Figure 1 shows the screen grab from AyeTides with the calculated 5 minute values overlaid as circles.

Figure 2. Astronomical Tide Forecasts for Portsmouth 24th November 2023 – Comparison of NTSLF and Admiralty EasyTide
Results: As an illustration of the likely uncertainty in astronomical tide curves, Figure 2 shows the data for Portsmouth Portsmouth from EasyTide and NTSLF. The NTSLF values are those used in calculating the tidal residuals observed at the the Portsmouth gauge which is part of the UK National Tide Gauge Network. Actual data from this gauge is available in real time from the Environment Agency (gauge 1028).
The statistics shown on this graph (and also in Table 1 below) are as follows:
- Diff.0-15 = Average difference (NTSLF – EasyTide) over whole period shown (midnight to 15:00 hrs)
- Diff.8-10 = Average difference (NTSLF – EasyTide) during the high tide period (08:00hrs to 10:00hrs)
- error estimates shown are the standard deviation of the individual 5 minute interval values
- Max value diff. = difference (NTSLF – EasyTide) of the maximum tidal heights predicted (usually these will occur at different times in each data set)
The tidal curves for Portsmouth from MrTides and Ayetides are compared in Figure 3 and in Table 1 below. The statistics are shown are similar to those defined above for Figure 2.
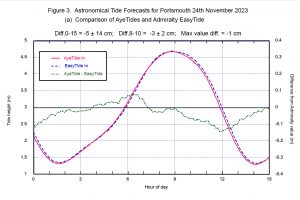
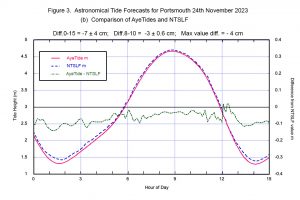
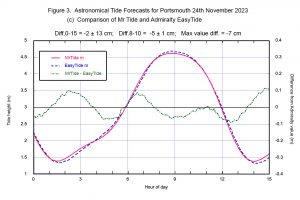
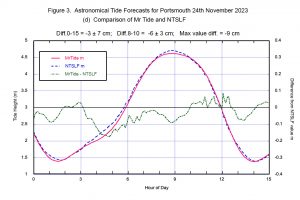
Fig. 3. Comparisons of astonomical tide curves for Portsmouth: (a -top left) AyeTides v EasyTide; (b -top right) AyeTides v NTSLF; (c – bottom left) MrTide v EasyTide; (d – bottom right) MrTide v NTSLF. [click to enlarge]
| NTSLF-EasyT | AyeT-EasyT | AyeT-NTSLF | MrT-EasyT | MrT-NTSLF | |
|---|---|---|---|---|---|
| Diff.0-15 | 18 ± 9 | -51 ± 8 | -70 ± 2 | -15 ± 7 | -33 ± 4 |
| s.d. | 148 | 141 | 36 | 126 | 65 |
| Diff.8-10 | 5 ± 4 | -29 ± 4 | -34 ± 1 | -50 ± 2 | -55 ± 5 |
| s.d. | 19 | 20 | 6 | 11 | 25 |
| Max val diff | 22 | -13 | -35 | -68 | -90 |
Table 1. Summary of the comparisons for Portsmouth. Average and standard deviation of tidal heights (mm) for midnight to 15:00 hours and for 8:00 to 10:00 hours; also the difference in maximum tidal heights (mm). The first data column summarises the comparison of EasyTide and NTSLF shown in Figure 2.
For the Southampton tidal forecasts only the comparison with the Admiralty EasyTide values is available. These are shown in Figure 4 and Table 2 for AyTides and Mr Tide.
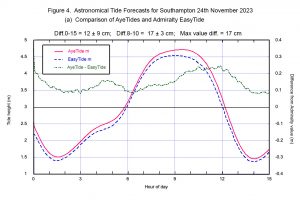
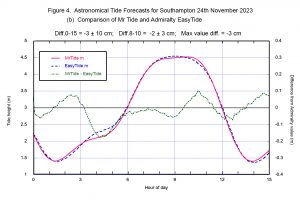
Fig. 4. Comparisons of astonomical tide curves for Southampton:
(a – left) AyeTides v EasyTide; (b -right) Mr Tide v EasyTide. [click to enlarge]
| AyeTides-EasyTide | Mr Tide-EasyTide | |
|---|---|---|
| Diff.0-15 | 116 ± 5 | -31 ± 6 |
| s.d. | 91 | 97 |
| Diff.8-10 | 166 ± 6 | -23 ± 6 |
| s.d. | 31 | 32 |
| Max val diff | 170 | -28 |
Table 2. Summary of the comparisons for Southampton. Average and standard deviation of tidal heights (mm) for midnight to 15:00 hours and for 8:00 to 10:00 hours; also the difference in maximum tidal heights (mm).
Discussion: The comparison of NTSLF and Admiralty values for Portsmouth (Figure 2) shows reassuring agreement between the two. Over the whole period the average difference was 2 ± 15 cm. The high standard deviation seems to be mainly due to a timing difference, with the NTSLF tide being ahead of the EasyTide value during the flood period. For coastal flooding forecasts we are most interested in the period about high water. Between 08:00hrs and 10:00hrs the difference was only 0.5 ± 2 cm. The difference in the calculated maximum height for the tide was only 2 cm with NTSLF being slightly higher.
Compared to both NTSLF and EasyTide, both AyeTides and Mr Tide tended to under-estimate the tidal heights for Portsmouth (Figure 3 and Table 1). However the differences were not great. Around the peak of the tide (normally most important for coastal flooding) the mean underestimate was about 3 cm for AyeTides ( 5 cm for Mr Tide) and the underestimate of the maximum tidal height was between 1 to 4 cm for AyeTides ( 7 to 9 cm ) for Mr Tides. Thus for Portsmouth the newer AyeTides application performed slightly better than its predecessor, Mr Tide.
Unfortunately the Southampton results are different (Figure 4 and Table 2). AyeTides shows a high bias throughout the tidal cycle being a maximum of about 17 cm at around the time of high water (Figure 4a). For coastal flooding estimation this error is unacceptably large. This bias was not present in the Mr Tide forecast (Figure 4b) which I have used successfully for Southampton in the past.
Conclusion: For Portsmouth the newer AyeTides application performed slightly better than its predecessor, Mr Tide. However For Southampton it has an unacceptably large bias. The older Mr Tide application can be used to forecast the astronomical tide for Southampton, whereas the newer AyeTides application can not.