
Storm Barra: Data and comments
[View diary entry for these plots] [View photos for the event]
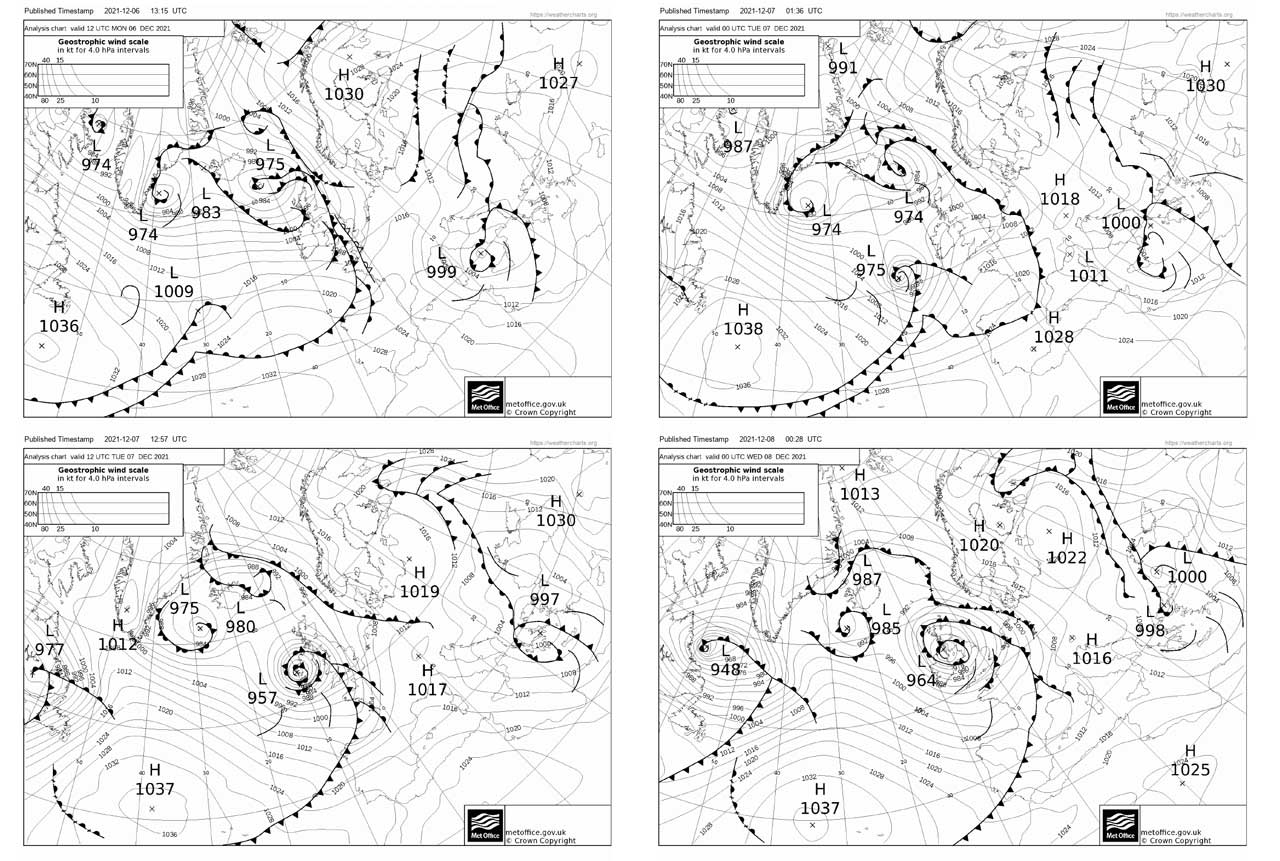
Surface analysis charts at 12 hour intervals from 12gmt 6th December to 00gmt 8th September.
On 6th December a complex low pressure system was centred over the Iceland to Scotland region with weak frontal sytems extending south over the UK . Storm Barra began as a wave depression on the trailing edge of one of these fronts and deepened rapidly as it approached Ireland. By 12gmt on 7th December storm Barra was centred over Eire with a central pressure of 957mb. During the storm passage severe winds in the cold sector region brought power outages and destruction to parts of Ireland and Scotland.
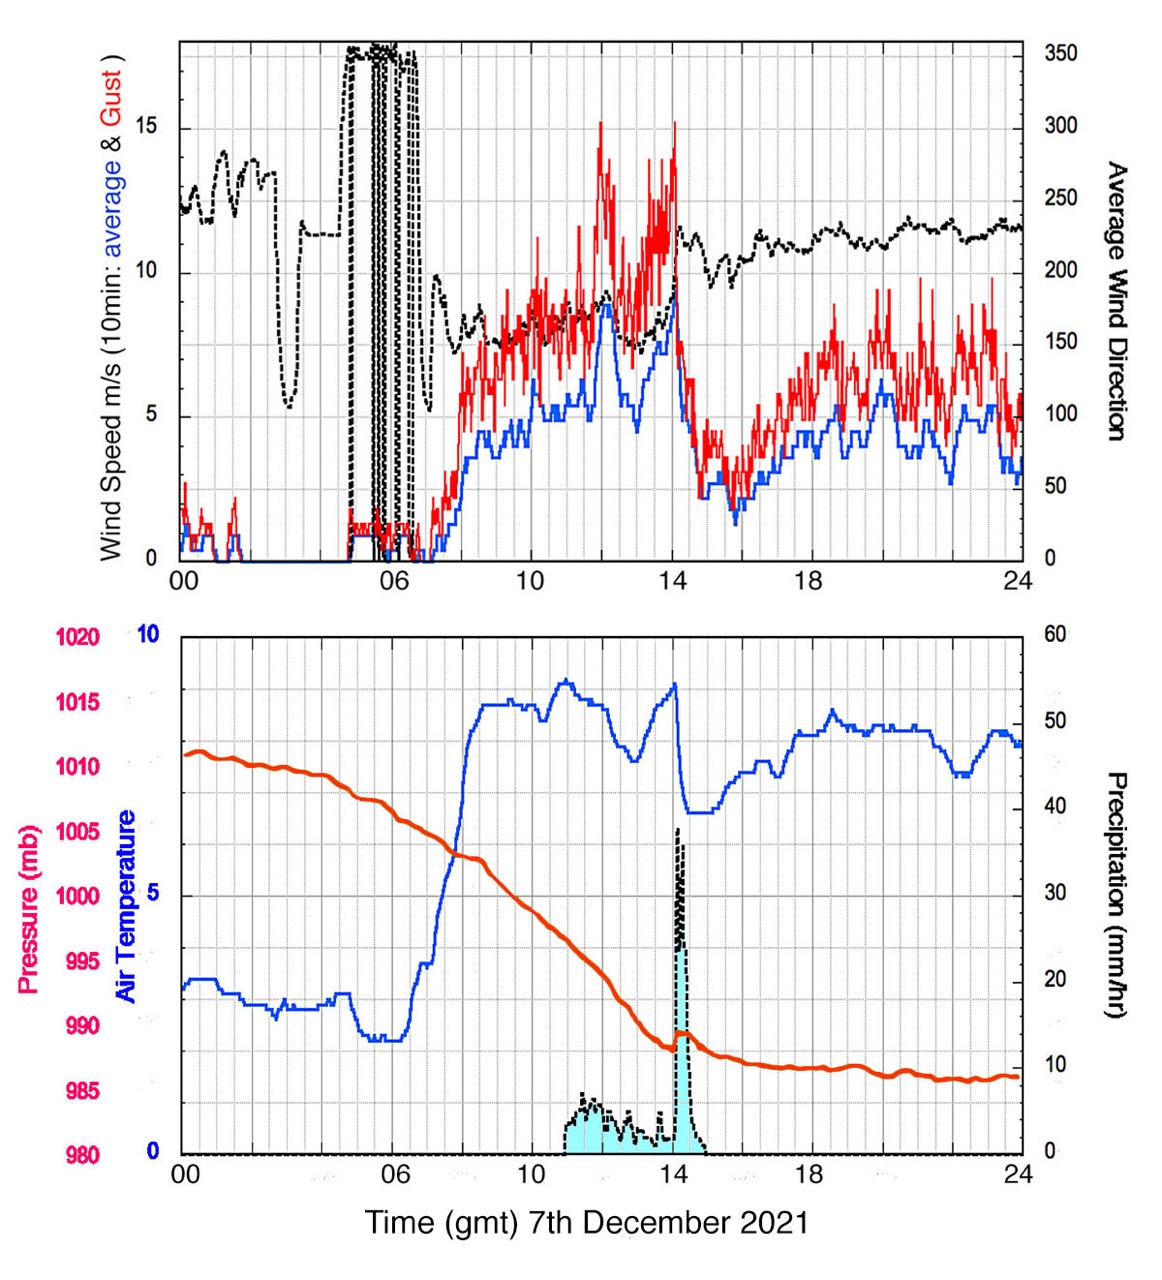
Weather at my jetty: (top) wind speed (average and gust) and wind direction; (bottom) Air temperature and pressure and rain rate.
Fortunately the most worst aspects of the storm were a long way north of Southampton. The weather station on my jetty showed wind gusts up to 15m/s (30 kts) from the SSE prior to a frontal passage at around 1415gmt. The front was accompanied by very heavy rain and a sharp pressure increase of about 1.5mb (which was also evident at Sotonmet).
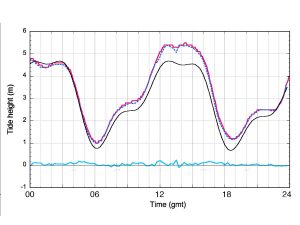
The surge is shown in the plots below. Plot (1) shows the water level (m above Chart Datum) as recorded at Woolston and Dock Head and the astronomical tide (from the “Mr Tides” app). The difference (Dock Head – Woolston) is also shown. On average Dock Head read 6cm (±0.7cm) higher than Woolston. Local resident Nigel Cook monitors tidal heights and suggests that it is the Dock Head gauge which reads high. The maximum level at Woolston was 5.40m whereas at Dock Head it was 5.5m (to 0.1m resolution). These values compare to the forecast of 5.26m.
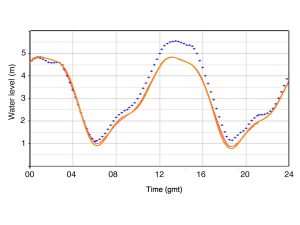
Plot (2) shows the observed water level at Portsmouth (mCD) and the astronomical tide as plotted on the NTSLF web site. The Portsmouth astronomical tide values from the “Mr Tides app” are also shown on Plot (2) and agree well with the NTSLF values except for at low water. Hence I’ve used the “Mr Tides” values for the two ports in calculating the surge anomaly for Portsmouth and Southampton. The predicted maximum level at Portsmouth was 4.83m at 1310gmt and at Southampton 4.68m at 1248gmt and 4.55m at 1459gmt for the first and second tidal peaks. The Environment agency had warned of a 0.6m surge coinciding with the second tidal peak to give a total 5.17m level. The warning was later updated to a 0.54m surge to increase the total level to 5.26m, suggesting that they now thought the maximum would be around the time of the first tidal peak.
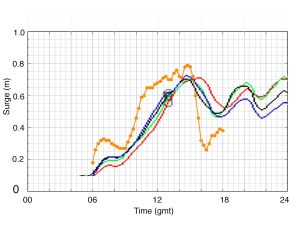
The NTSLF storm surge forecast for Portsmouth is shown in plot (3) where I’ve used the version using the 00gmt run on the 7th. Later forecasts did not alter the predicted middle day surge significantly although the overnight 7th-8th December surge did decrease in subsequent forecasts. The different colours represent the different Met Office model runs: blue=00gmt, red=06gmt, green=12gmt, black=18gmt. I have arbitrarily increased the forecast surge values by 10cm, being the typical amount by which NTSLF under-predicts Portsmouth surge values and the amount I allow for in using their predictions. Shown in orange on plot (3) is the observed surge at Portsmouth. Even with the 10cm correction applied the observed surge was under estimated by around 10cm.
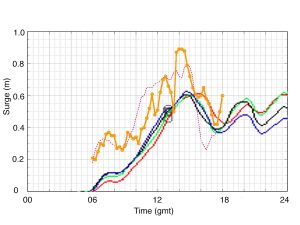
Plot (4) is similar to plot (3) except that the observed Southampton surge values are shown in orange. For this plot the NTSLF surge predictions have not been adjusted by 10cm so would be similar to those used by the Environment Agency for the flood warning. Compared to Portsmouth (shown faintly in red) the surge in Southampton showed a large peak at and just after 14gmt. Although the surge values are calculated using the Woolston tide gauge, this peak surge does correspond to the short period of enhanced levels seen at St Denys, followed by a rapid lowering. The implied 0.9m surge is much larger than was forecast by NTSLF for Portsmouth and larger than the Portsmouth surge observations. The extra surge at Southampton is of similar order to the wind setup that the 15m/s SSE winds blowing along Southampton Water could create. However the ABP tide tables suggest negligible effect from such a wind.
 The maximum water level in the river was not enough to cause flooding into the road from the public hard or peoples’ gardens. However flooding in Priory Road welled up out of the drains and appeared to continue even as the river level went down. Water was upwelling from one of the drain covers and it seems likely that at least some of this water was due to the rain storm rather than the river level.
[View diary entry for these plots] [View photos for the event]