
1st/2nd Nov Storm Ciarán data
Met Office analyses
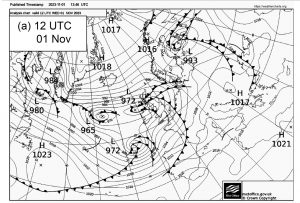
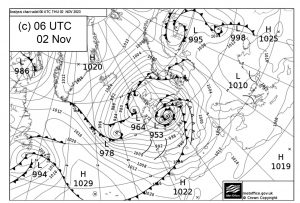
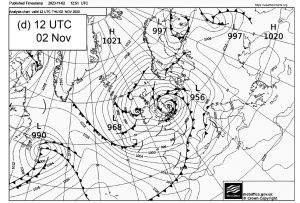
The following weather charts originated from the weathercharts.org website. They show storm Ciarán as a 972mb low in the western approaches at noon on 1st November. It deepened to become around 953mb between midnight to 06:00 on 2nd November. The midnight analysis suggests the potential for a sting jet affecting the Channel Islands and for a narrow strip along the north coast of France where wind gusts over 80 kts resulted in widespread damage to buildings, fallen trees, and reports of a tornado in eastern Jersey 1.

Weather data from my jetty
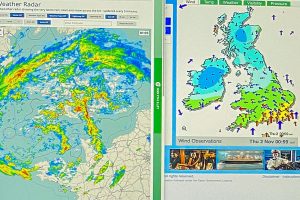
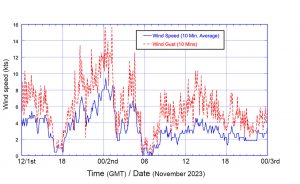
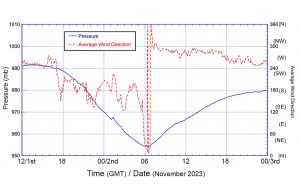
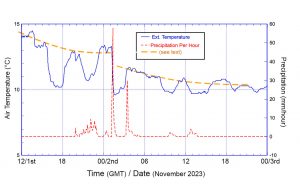
By chance I took a photo of my computer screens at 01:14 on 2nd November coinciding with the frontal passage at Southampton. The portion of the photo shown below has the Met Office rain radar image (at 01:05) and the xcweather wind observations (for 00:59). The latter indicate the rapid fall in wind speed (graph (a)) following the frontal passage, marked by a blip in the pressure curve (graph (b)) and a short period of intense rainfall (graph (c)). I’ve speculated that the air mass temperature was roughly that shown by the dashed orange line and that the temperature dips, of 1 or 2 degrees were the effects of cold air downdrafts due to the rain, also that the downdraft at the front caused the observed pressure blip.
The minimum observed air pressure near the depression centre was 954.3mb at 06:03 with the winds falling very light. The previous south to southeast winds changed to northwest as the depression passed and then backed to more westerly.
Water Levels
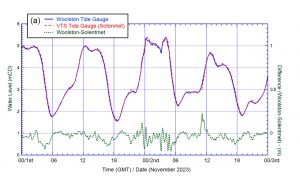
Tidal height data were available from the Environment Agency Woolston Tide Gauge (1034) and the ABP Dock Head gauge for which data is available from Sotonmet at 5 minute intervals but only to 0.1m resolution. To minimise artefacts the 5 minute interval Sotonmet data were smoothed with a 5 point binomial filter. The EA data are available as graphs and can be downloaded at 15 minute intervals to 0.001m resolution. To enable detailed comparison the EA data from Woolston and Portsmouth (gauge 1028 available from NTSLF), and the various astronomical tide estimates have all been digitised and interpolated to 5 minute intervals using the method described previously.
The two data sources for tide height are compared in graph (a) below. In a previous comparison in 2020 I found that the Woolston gauge read higher by 9 ± 2 cm and lagged the Sotonmet data by about 2 minutes. However for this data the Dock Head gauge reads higher with the mean difference ± standard error being: before filtering = 37 ± 3mm (s.d. 63mm); after filtering = 38 ± 2mm (s.d. 55mm); filtered and with 2.5 minute lag = 36 ± 2mm (s.d.48mm). Thus the filtering made no significant difference to this comparison except to remove higher frequency noise from the differences. In case small time base differences were dominating the comparison I checked the difference at “high tide” (water level > 4.6mCD) and found Dock Head higher by 45 ± 4mm (s.d. 48mm). Looking at the difference data in graph (a) it is interesting that the there are shorter time period variations during the storm Ciarán high tide period; I have no explanation for this.
The maximum water levels recorded overnight on the 1st/2nd November are shown in the Table (note that time resolution is 5 minutes). The water levels at the Woolston Gauge better match what I observed at the jetty where the first tidal peak did not enter the shed but the second peak was higher and did enter.
| 1st peak | 2nd peak | |||
|---|---|---|---|---|
| Gauge | Time | m | Time | m |
| Woolston Data | 00:10 | 5.36 | 04:10 | 5.40 |
| Dock Head Data | 00:30 | 5.39 | 04:05 | 5.40 |
| MrTide Astronomical | 01:15 | 4.32 | 03:20 | 4.34 |
| Skew surge (Woolston) | – | 1.04 | – | 1.06 |
I have chosen the better resolution Woolston Data for the rest of the comparisons but it should be remembered that, although two gauges did show very similar variations, the Dock Head gauge water levels suggested the water level might have been slightly higher (by about 4 cm).
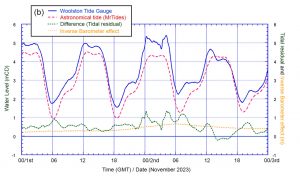
The size of the tidal residual (“storm surge”) is shown in graph (b). Because past values of the Admiralty astronomical tide curve are not available from the EasyTide website I have used astronomical tide values from the MrTides app. My previous comparison suggests that MrTides might underestimate astronomical tidal heights for Southampton by 2 to 3 cm. In the table above I have shown the “skew surge” (Woolston peak – MrTides peak). Had I used the Dock Head values and corrected MrTides, the skew surge values would be very similar.
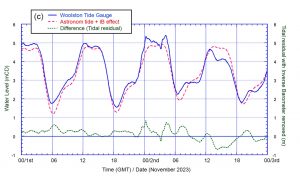
Based on the observed pressures the inverse barometer effect (“IB”) explains the general variation of the residual but not the extreme peaks. This is illustrated in graph (c) where the IB effect has been added to the astronomical values from MrTides and compared to the observations.
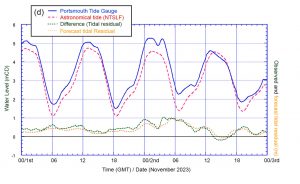
How well was the storm surge forecast? Graph (d) shows the observations from the Portsmouth tide gauge and the astronomical tide predicted by NTSLF. The observed tidal residual and the residual which would have been forecast had the synoptic analysis been available in real time are in reasonable agreement. However the second tidal peak at around 03:30 was not forecast. In the residual forecasts available in real time based on the Met Office weather forecast runs, a peak at this time was predicted from the 1800/1st run but not at any other time.
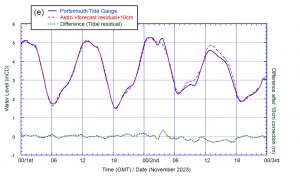
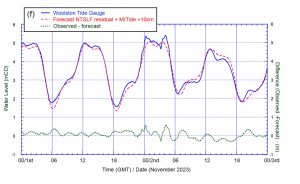
The result of using the forecast residual with a 10cm addition (my normal practice based on past experience)is shown in graph (e). The overnight tide at Portsmoth was predicted well except for the second peak. The total level forcast by using the Portsmouth residual (+10cm ) and the Mr Tide astronomical tide is shown in graph (f). Neither peak in the Southampton tides was predicted.
Using the NTSLF residual as published plus astronomical tide from MrTides would have given a maximum water level of 4.96m or 4.98 if Easytide had been used for the astronomical tide. So the actual maximum (5.4m) was underestimated by over 0.4m. It looks as if the peak surge was after the peak astronomical tide so we were lucky that the flooding was not worse.
1 Mike Kendon, Storm Ciarán, 1 to 2 November 2023, Met Office National Climate Information Centre, 9/11/2023, pdf report, 9pp.